Amazon / PPC
→ $5,987 / mo modeled
next $100 ≈ $313 back
search intent · fastest feedback loop
DAX connected traffic, product clicks, conversion and order value into one decision model. Move a control to inspect how the delivered system isolates each growth lever.
Use the controls to inspect how DAX's model connects the sales path and monthly projection. Toggle an improvement to compare its modeled effect.
52,320 visits/mo × 34.0% CTR × 2.99% CVR × 1.12 email-flow orders × $64 AOV = $38,127 / month
Model, stated plainly: GEO ramps to +9% traffic over 7 months · CRO adds +15% CVR from month 2 (40% in month 1) · email flows reach +12% orders by month 2 · no baseline growth is assumed — the shaded gap is the program effect, not market drift.
Every channel follows r(s) = cap · (1 − e−s/k): the first dollars work hardest, then the curve flattens. Drag any spend slider — or let the optimizer equalize marginal return across all five. One owner, channels pulling together.
search intent · fastest feedback loop
compounding · slow start, high ceiling
owned list · brutal efficiency, hard cap
answer-engine citations · structured for AI
The gap — AI answers cite so few stores that early movers own the shelf
demand creation · needs scale to pay
Curves are scripted demo assumptions — steady-state monthly return per channel, stated so they can be argued with. The optimizer allocates the same total in $50 steps to whichever channel's marginal return is highest. That is the whole trick of media planning, visible.
Owner-priced tiers. What each buys is listed, not implied — and everything hands over: source files, keyword sheets, report templates.
Recurring buyer complaints from this category, paraphrased — and the way this engine is built to not repeat them. No sellers named.
“Paid for a top-rated seller, got the same paste-in setup as every other store — my products and region ignored.”
The simulator above is the counter-offer: your traffic, your margins, your channels. The plan falls out of your numbers, not out of a template.
“The literal task got done, then silence — zero guidance on what to automate or fix next.”
Every monthly report ranks the next fixes by impact versus effort. Strategy is part of the deliverable, not an upsell you have to know to ask for.
“Thorough work, flat dashboard — and no one will say whether the spend is paying off.”
Ramps are modeled before you pay. The projection above says what month 3 should look like, so “is it working?” has a reference line instead of a shrug.
“Quoted one week. Delivered… eventually. The work was fine; the waiting wasn't.”
Turnarounds are printed on the tiers above, and the monthly cycle has fixed report dates. Late becomes measurable, so it doesn't happen quietly.
“The big-brand sellers make you DM for a price before you can even compare.”
Pricing sits on this page, next to the math it buys. Compare away.
Nine services in the marketing catalog — each one tied to the exact panel or interaction above that demonstrates it.
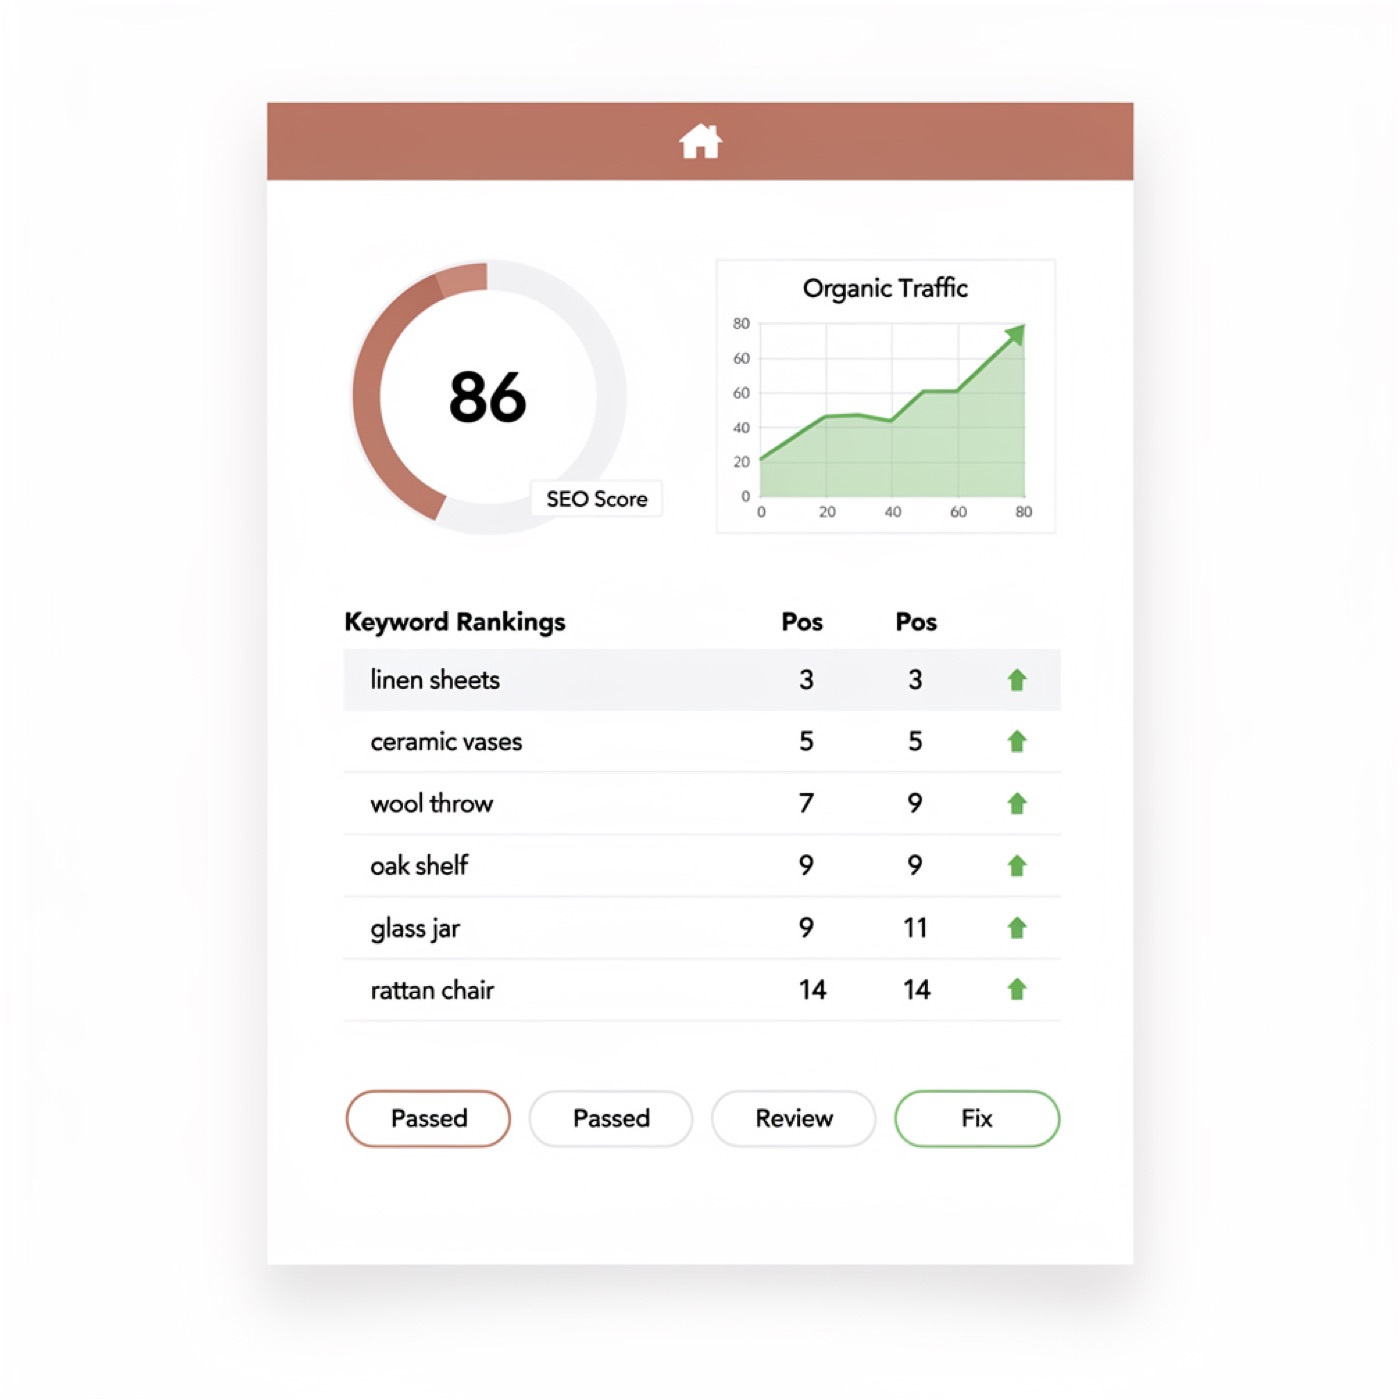
The Store-SEO channel card runs the slowest, highest-ceiling curve in the mix builder — and carries a scorecard sample, because rank work is a monthly return, not a vibe.
Flip the email-flows switch and watch orders step up 12% in the funnel — welcome, abandoned-cart and winback flows, modeled to full effect by month 2.
Paid social holds the steepest scale curve in the channel-mix builder — the optimizer shows exactly when it has earned a bigger slice of the budget.
Rename the funnel's stations — visits to list, list to qualified leads — and the same four-dial math prices a B2B prospecting engine before you build it.
Every ramp in the 12-month projection assumes the flows fire without a human — automation wiring is why month 1 looks like month 1 and not month 4.
The CRO toggle multiplies the CVR stage by 1.15 and the funnel redraws instantly — a conversion audit reduced to its honest, checkable effect.
The orders leaving stage three need a pipeline to land in — CRM stages mirror the funnel's stations, kept in one system so the numbers reconcile.
The honest-math line under the funnel is the whole discipline: every figure on this page recomputes from four inputs you can drag and audit.
PPC anchors the mix with the strongest early marginal return — and the proof panel shows the ACoS/ROAS report format it gets tracked in, monthly.
ballymalik (e-commerce PPC) — review sample 4 × 5.0 + 1 × 4.7 · portfolio headline “US Supplements — ACoS 72% → 27%”
alexiscottray (CRO) — review sample 5 × 5.0, incl. “24-page report and a very deep video walkthrough”
Sampled from public marketplace listings, Mar–May 2026 — shown as the bar the market sets, not as DAX results.
The demo runs on scripted assumptions. The engagement runs on your numbers — same dials, same visible math, your funnel.